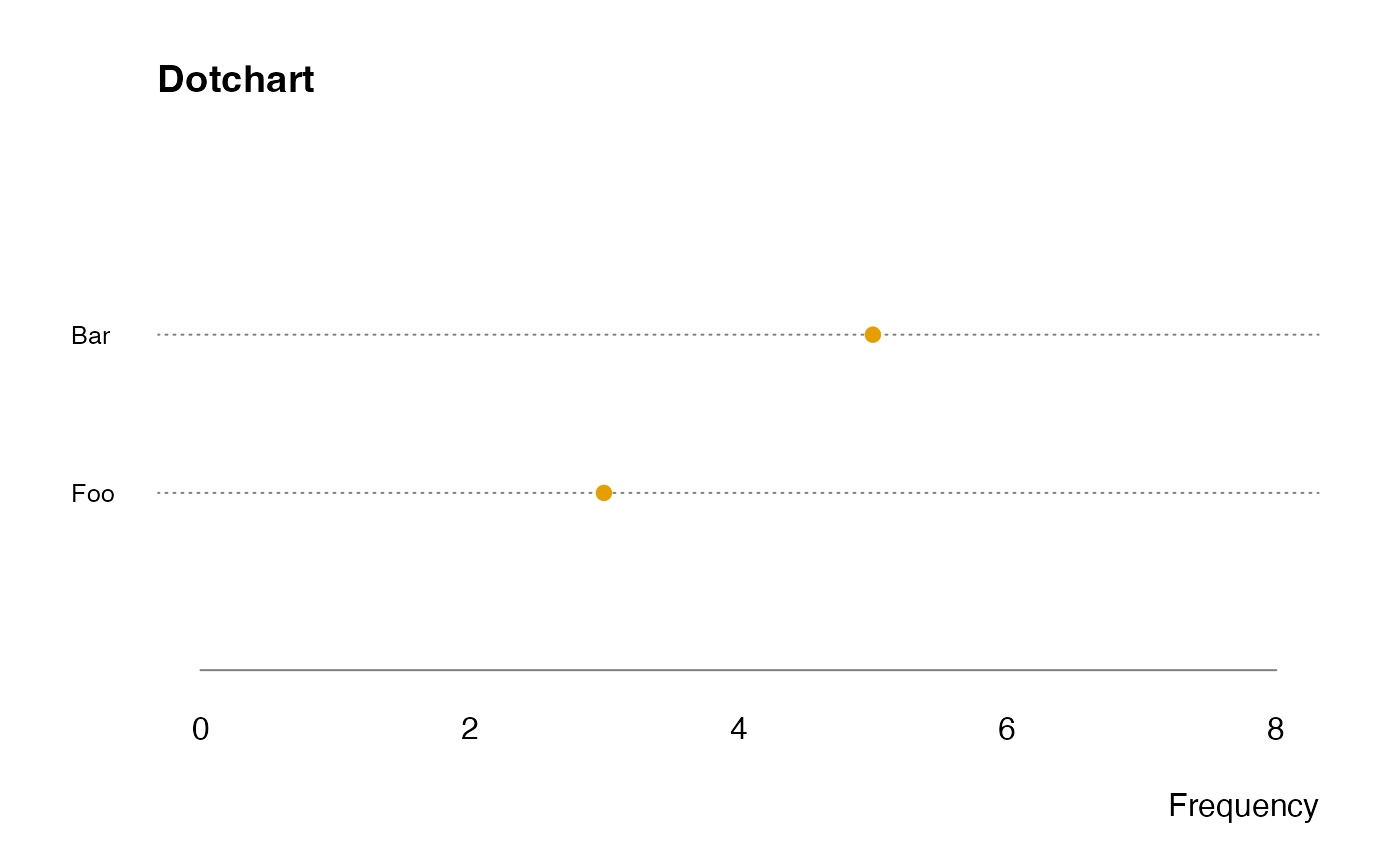
This is a simplified and customized version of graphics::dotchart().
plot_dots(
  x,
  xlim = c(0, max(x)),
  main = "Dotchart",
  xlab = "Frequency",
  col = palette.colors(2L)[2L],
  pch = 19L
)
Arguments
- x
numeric, values to plot.- xlim
numeric(2), limits of the x-axis.- main
character(1), plot title.- xlab
character(1), x-axis label.- col
integer/character, color of the dots.- pch
integer/character, point character/symbol of the dots.
Value
nothing, used for its side-effects (plotting).