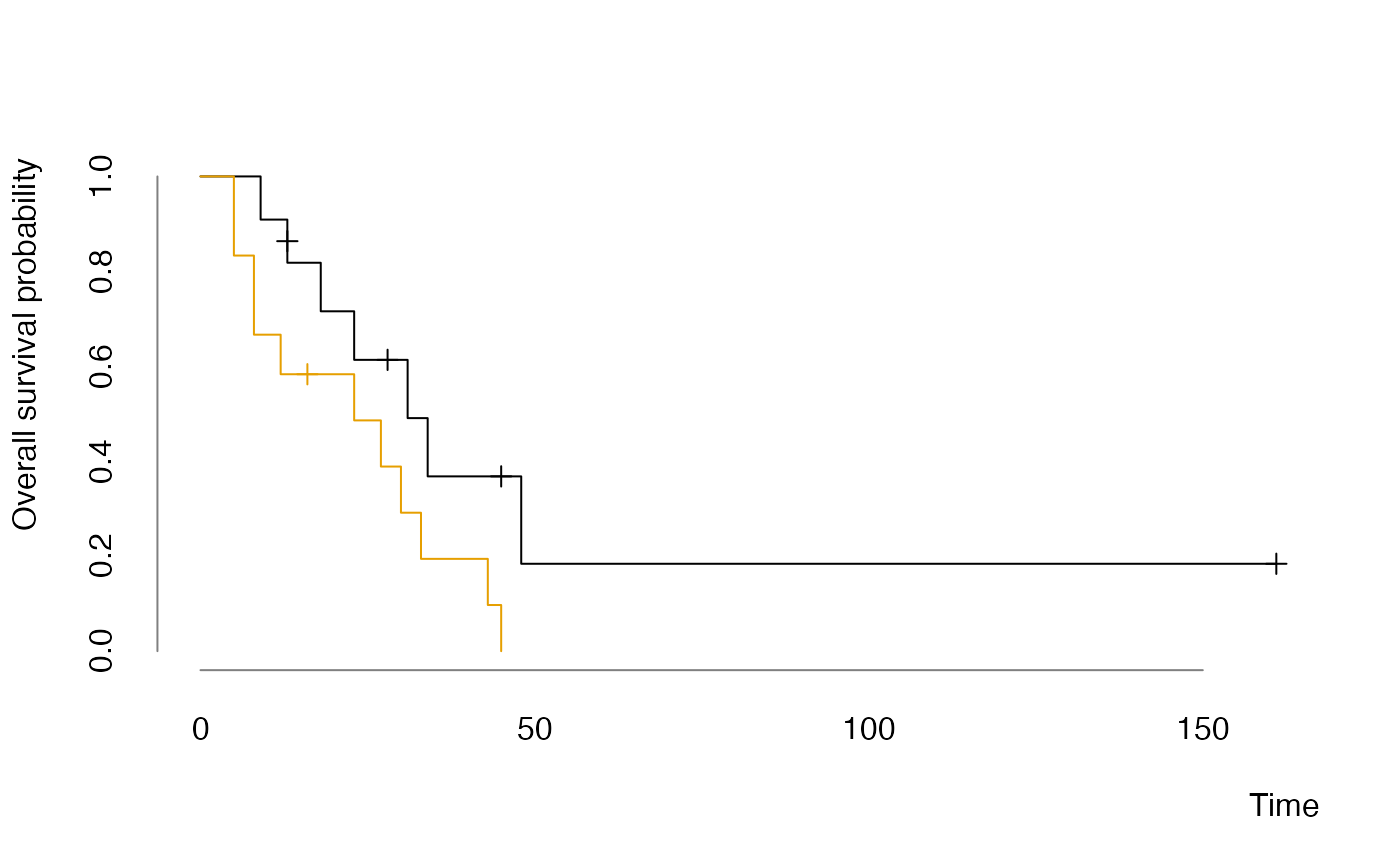
This is just a wrapper method around survival::plot.survfit() with
custom defaults.
plot_surv(
  x,
  main = character(),
  xlab = "Time",
  ylab = "Overall survival probability",
  mark.time = TRUE,
  conf.int = FALSE,
  col = palette.colors(max(1L, length(x$strata))),
  times,
  ...
)
Arguments
- x
survfitobject.- main
character(1), plot title.- xlab
character(1), x-axis label.- ylab
character(1), y-axis label.- mark.time
logical(1), ifTRUEcensoring times are marked, seesurvival::plot.survfit()for details.- conf.int
logical(1), ifTRUEconfidence interval is plotted, seesurvival::plot.survfit()for details.- col
integer/character, specifying colors for each curve.- times
integer, vector of times to print on the x-axis.- ...
further arguments passed to
survival::plot.survfit().
Value
a list with x and y containing the coordinates of the last point
of each curves.
See also
Examples
library("survival")
srvfit <- survfit(Surv(time, status) ~ x, data = aml)
plot_surv(srvfit)
