Additional Tools for glmnet
glmnettools.RmdIntroduction
The glmnettools package offers functions for repeated cross-validation and prediction of survival probabilities using the glmnet package (Friedman, Hastie, and Tibshirani 2010; Simon et al. 2011).
Repeated Cross-Validation
The example is taken from the cv.glmnet manual page (?"glmnet::cv.glmnet"):
library("glmnettools")## Loading required package: glmnet## Loading required package: Matrix## Loaded glmnet 4.1-1
# Generating example data
set.seed(1010)
n <- 1000
p <- 100
nzc <- trunc(p/10)
x <- matrix(rnorm(n * p), n, p)
beta <- rnorm(nzc)
fx <- x[, seq(nzc)] %*% beta
eps <- rnorm(n) * 5
y <- drop(fx + eps)
set.seed(1011)
# nrepcv should usually be higher but to keep the runtime of the example low
# we choose 2 here, same for the nfolds
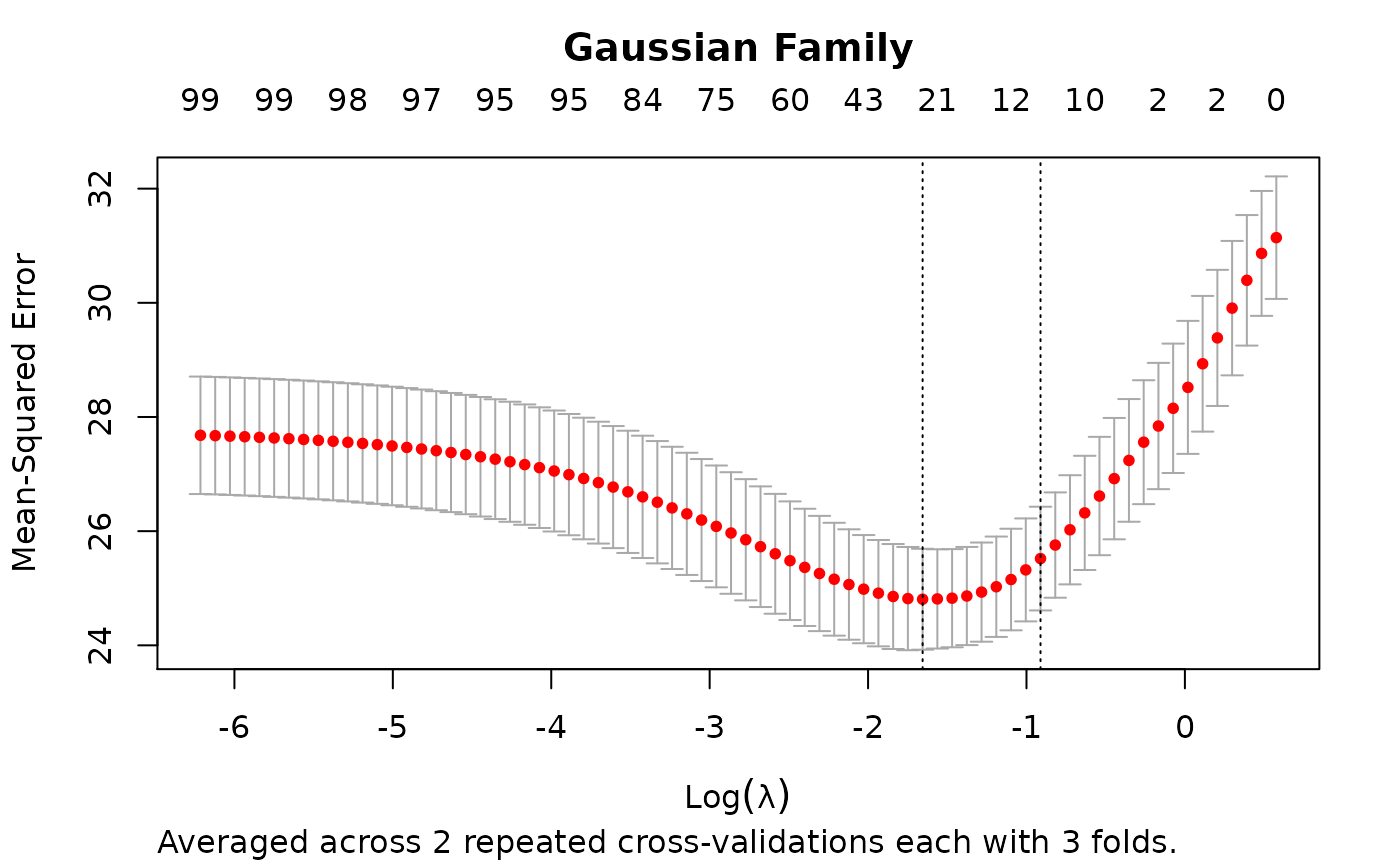
rcvob <- rcv.glmnet(x, y, nrepcv = 2, nfolds = 3)
plot(rcvob)
title("Gaussian Family", line = 2.5)
## 6 x 1 sparse Matrix of class "dgCMatrix"
##                      1
## (Intercept) -0.1162737
## V1          -0.2171531
## V2           0.3237422
## V3           .
## V4          -0.2190339
## V5          -0.1856601
predict(rcvob, newx = x[1:5, ], s = "lambda.min")## 1
## [1,] -1.3447658
## [2,] 0.9443441
## [3,] 0.6989746
## [4,] 1.8698290
## [5,] -4.7372693Prediction Survival Probabilities
The example data are taken from the survival package (Therneau 2020).
library("survival")

data("pbc")
pbc <- pbc[complete.cases(pbc),]
x <- data.matrix(pbc[!colnames(pbc) %in% c("id", "time", "status")])
y <- Surv(pbc$time, as.integer(pbc$status == 2))

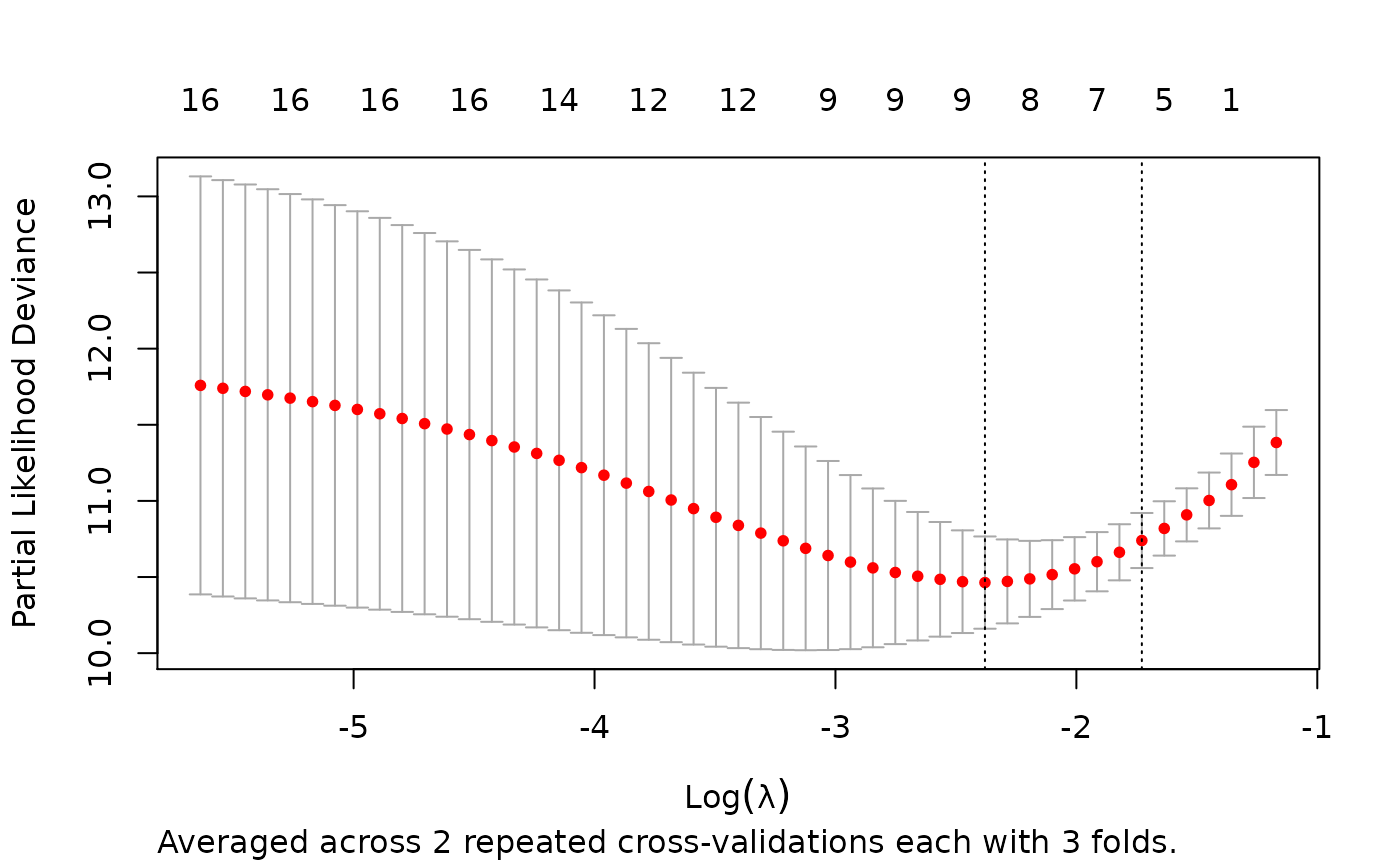
rcvob <- rcv.glmnet(x, y, family = "cox", nrepcv = 2, nfolds = 3)

plot(rcvob)
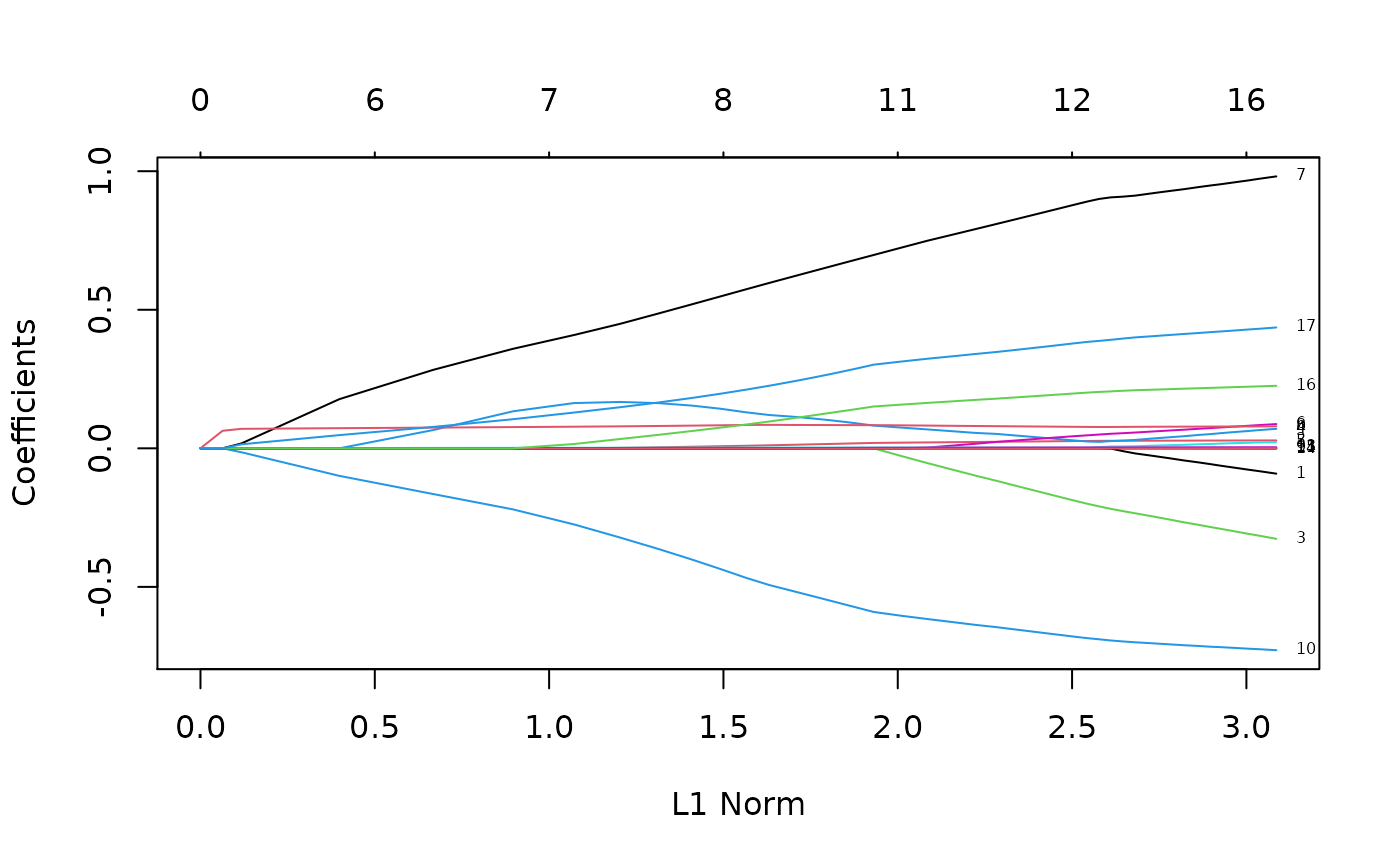
plot(rcvob$glmnet.fit, label = TRUE)
nz <- predict(rcvob, type = "nonzero", s = "lambda.1se")[, 1]
nz
## [1] 4 7 8 10 11 17
colnames(x)[nz]## [1] "ascites" "edema" "bili" "albumin" "copper" "stage"
## predicting survival probabilities
predict(
    rcvob,
    newx = x[1:5,], x = x, y = y, s = "lambda.1se",
    type = "survival", times = c(2, 5) * 365.25
)
## 1 2 3 4 5
## [1,] 0.6495132 0.9332673 0.8840982 0.8871642 0.9018266
## [2,] 0.2206888 0.7851936 0.6496395 0.6575624 0.6964087
## linear predictor
predict(rcvob, newx = x[1:5,], type = "link", s = "lambda.1se")
## 1
## 1 1.5419437
## 2 -0.2903701
## 3 0.2883068
## 4 0.2598010
## 5 0.1125585
Convert rcv.glmnet/coxnet Objects into coxph or cph Objects
For further investigation/processing packages like survival and/or rms offer a lot of useful functions (Therneau 2020; Harrell Jr 2020). That’s why glmnettools provides some helper functions to convert between these objects.
## Loading required package: Hmisc## Loading required package: lattice## Loading required package: Formula## Loading required package: ggplot2##
## Attaching package: 'Hmisc'## The following objects are masked from 'package:base':
##
## format.pval, units## Loading required package: SparseM##
## Attaching package: 'SparseM'## The following object is masked from 'package:base':
##
## backsolve
tm <- 2 * 365.2
cx <- as.cph(rcvob, x = x, y = y, s = "lambda.1se", time.inc = tm)

set.seed(123)
## B should be much higher in real life
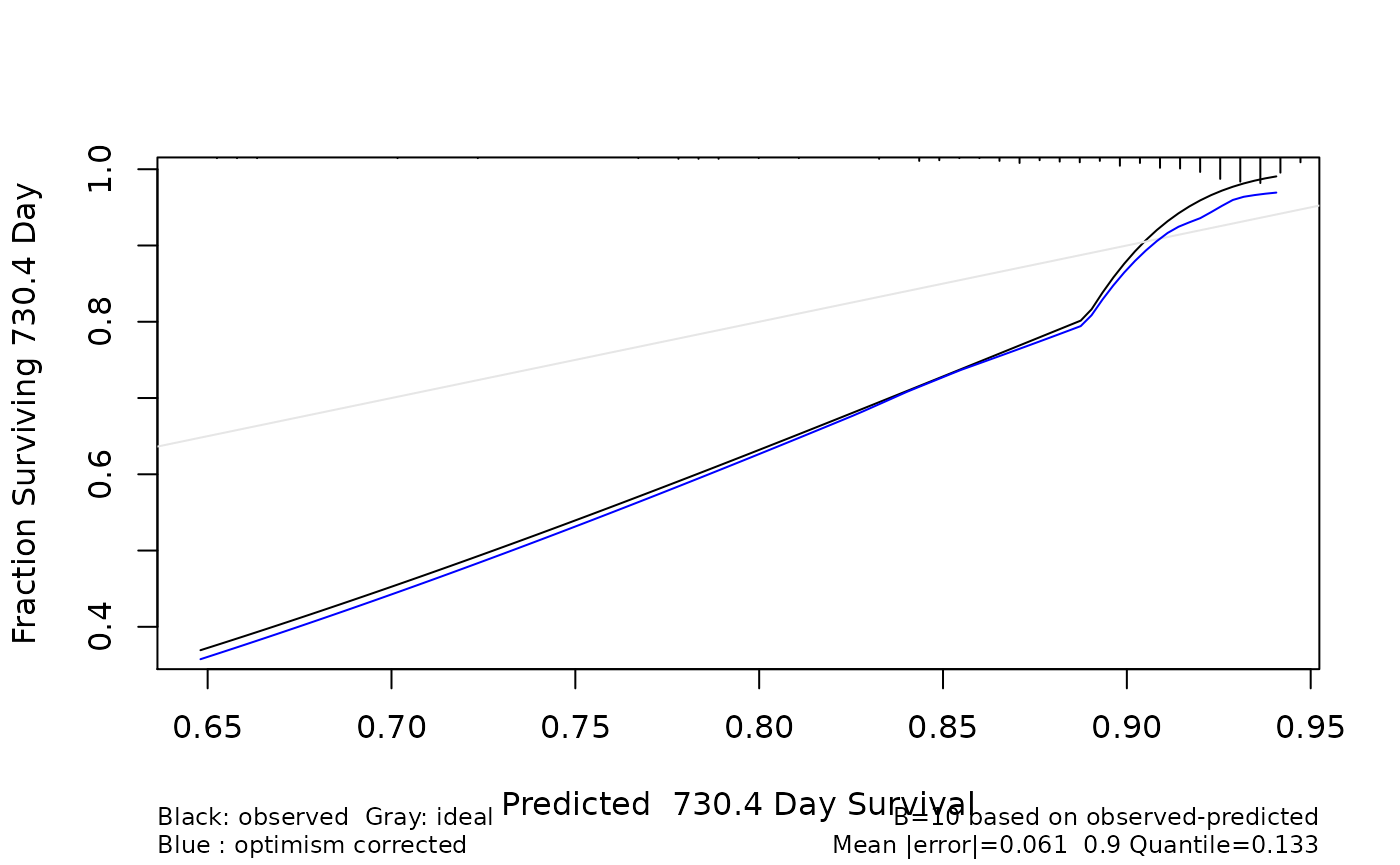
cb <- calibrate(cx, B = 10, u = tm)
## Using Cox survival estimates at 730.4 Days
cb## calibrate.cph(fit = cx, u = tm, B = 10)
##
##
## n=276 B=10 u=730.4 Day
##
##
## Mean |error|:0.06093228 0.9 Quantile of |error|:0.1334867
plot(cb)
Session information
## R version 4.0.4 (2021-02-15)
## Platform: x86_64-pc-linux-gnu (64-bit)
## Running under: Ubuntu 20.04.2 LTS
##
## Matrix products: default
## BLAS:   /usr/lib/x86_64-linux-gnu/blas/libblas.so.3.9.0
## LAPACK: /usr/lib/x86_64-linux-gnu/lapack/liblapack.so.3.9.0
##
## locale:
##  [1] LC_CTYPE=C.UTF-8       LC_NUMERIC=C           LC_TIME=C.UTF-8
##  [4] LC_COLLATE=C.UTF-8     LC_MONETARY=C.UTF-8    LC_MESSAGES=C.UTF-8
##  [7] LC_PAPER=C.UTF-8       LC_NAME=C              LC_ADDRESS=C
## [10] LC_TELEPHONE=C         LC_MEASUREMENT=C.UTF-8 LC_IDENTIFICATION=C
##
## attached base packages:
## [1] stats     graphics  grDevices utils     datasets  methods   base
##
## other attached packages:
##  [1] rms_6.1-1         SparseM_1.81      Hmisc_4.5-0       ggplot2_3.3.3
##  [5] Formula_1.2-4     lattice_0.20-41   survival_3.2-7    glmnettools_0.0.4
##  [9] glmnet_4.1-1      Matrix_1.3-2
##
## loaded via a namespace (and not attached):
##  [1] sass_0.3.1          jsonlite_1.7.2      splines_4.0.4
##  [4] foreach_1.5.1       bslib_0.2.4         assertthat_0.2.1
##  [7] highr_0.8           latticeExtra_0.6-29 yaml_2.2.1
## [10] pillar_1.5.0        backports_1.2.1     quantreg_5.85
## [13] glue_1.4.2          digest_0.6.27       RColorBrewer_1.1-2
## [16] checkmate_2.0.0     sandwich_3.0-0      colorspace_2.0-0
## [19] htmltools_0.5.1.1   conquer_1.0.2       pkgconfig_2.0.3
## [22] mvtnorm_1.1-1       scales_1.1.1        jpeg_0.1-8.1
## [25] MatrixModels_0.5-0  tibble_3.1.0        htmlTable_2.1.0
## [28] ellipsis_0.3.1      TH.data_1.0-10      cachem_1.0.4
## [31] withr_2.4.1         nnet_7.3-15         magrittr_2.0.1
## [34] crayon_1.4.1        polspline_1.1.19    memoise_2.0.0
## [37] evaluate_0.14       fs_1.5.0            fansi_0.4.2
## [40] nlme_3.1-152        MASS_7.3-53         foreign_0.8-81
## [43] textshaping_0.3.1   tools_4.0.4         data.table_1.14.0
## [46] multcomp_1.4-16     lifecycle_1.0.0     matrixStats_0.58.0
## [49] stringr_1.4.0       munsell_0.5.0       cluster_2.1.0
## [52] compiler_4.0.4      pkgdown_1.6.1       jquerylib_0.1.3
## [55] systemfonts_1.0.1   rlang_0.4.10        grid_4.0.4
## [58] iterators_1.0.13    rstudioapi_0.13     htmlwidgets_1.5.3
## [61] base64enc_0.1-3     rmarkdown_2.7       gtable_0.3.0
## [64] codetools_0.2-18    R6_2.5.0            zoo_1.8-8
## [67] gridExtra_2.3       knitr_1.31          fastmap_1.1.0
## [70] utf8_1.1.4          rprojroot_2.0.2     ragg_1.1.1
## [73] shape_1.4.5         desc_1.2.0          stringi_1.5.3
## [76] parallel_4.0.4      Rcpp_1.0.6          vctrs_0.3.6
## [79] rpart_4.1-15        png_0.1-7           xfun_0.21
References
Friedman, Jerome, Trevor Hastie, and Robert Tibshirani. 2010. “Regularization Paths for Generalized Linear Models via Coordinate Descent.” Journal of Statistical Software 33 (1): 1–22. https://www.jstatsoft.org/v33/i01/.
Harrell Jr, Frank E. 2020. Rms: Regression Modeling Strategies. https://CRAN.R-project.org/package=rms.
Simon, Noah, Jerome Friedman, Trevor Hastie, and Rob Tibshirani. 2011. “Regularization Paths for Cox’s Proportional Hazards Model via Coordinate Descent.” Journal of Statistical Software 39 (5): 1–13. https://www.jstatsoft.org/v39/i05/.
Therneau, Terry M. 2020. A Package for Survival Analysis in R. https://CRAN.R-project.org/package=survival.