Authors: Sebastian Gibb [aut, cre], Paul Ahrens
[aut, dtc], Daniel Steinbach [aut, dtc], Maria Schmidt [aut, dtc],
Thorsten Kaiser [aut, dtc], Mark Wernsdorfer [dtc], Matthias Nauck
[dtc], Stefan Bollmann [dtc], Thomas Hildebrandt [dtc]
Last modified: 2024-03-07 08:43:33.649335
Compiled: Thu Mar 7 08:45:51 2024
Introduction
The data were collected as part of the AMPEL project (Analysis and Reporting System for the Improvement of Patient Safety through Real-Time Integration of Laboratory Findings, ). They include administration data, sepsis labels based on ICD10 codes and laboratory diagnostics from patients admitted to the University Hospital Leipzig between Januar 2014 and December 2019 and to the University Hospital Greifswald between Januar 2015 and December 2020, respectively. Additionally it provides functions to generate a similar dataset from MIMIC-IV (Johnson et al. 2021).
Installation
You can install the released version of sbcdata from
directly from github:
# install.packages("remotes")
remotes::install_github("ampel-leipzig/sbcdata")
License
The datasets are available under the CC-BY license.
Citation
To cite the sbcdata package, please use:
citation("sbcdata")## To cite the sbcdata package in publications use:
##
## D. Steinbach, et al. 2024. Applying Machine Learning to Blood Count
## Data Predicts Sepsis with ICU Admission Clinical Chemistry 70,
## 506-515.
##
## A BibTeX entry for LaTeX users is
##
## @Article{sbcdata,
## title = {Applying Machine Learning to Blood Count Data Predicts Sepsis with {ICU} Admission},
## author = {Daniel Steinbach and Paul C. Ahrens and Maria Schmidt and Martin Federbusch and Lara Heuft and Christoph Lübbert and Matthias Nauck and Matthias Gründling and Berend Isermann and Sebastian Gibb and Thorsten Kaiser},
## volume = {70},
## number = {3},
## pages = {506--515},
## year = {2024},
## doi = {10.1093/clinchem/hvae001},
## journal = {Clinical Chemistry},
## publisher = {Oxford University Press},
## }The sbcdata package
Overview
The sbcdata dataset contains ncol(sbcdata)
variables for nrow(sbcdata) laboratory diagnostics.
str(sbcdata)## Classes 'data.table' and 'data.frame': 2709568 obs. of 18 variables:
## $ Id : int 1 2 3 3 3 3 3 3 3 3 ...
## $ Age : int 25 75 77 77 77 77 77 77 77 77 ...
## $ Sex : chr "W" "M" "W" "W" ...
## $ Diagnosis: chr "Control" "Control" "Sepsis" "Sepsis" ...
## $ Center : chr "Greifswald" "Greifswald" "Greifswald" "Greifswald" ...
## $ Set : chr "Validation" "Validation" "Validation" "Validation" ...
## $ Sender : chr "AMB" "GEN" "OTHER" "OTHER" ...
## $ Episode : int 1 1 1 1 1 1 1 1 1 1 ...
## $ Time : num 0 0 0 318840 578640 ...
## $ TargetIcu: chr NA NA NA NA ...
## $ SecToIcu : num NA NA NA NA NA NA NA NA NA NA ...
## $ CRP : num 15.5 7.4 96.1 57 93.4 74.3 51.7 27 48 95.7 ...
## $ HGB : num 7 8.4 4.8 4.4 5.7 5.7 5.8 5.6 6.2 5.9 ...
## $ MCV : num 80.5 87.9 81.7 82.2 82 81.7 85.1 84.7 85.6 83.3 ...
## $ PCT : num NA NA NA NA 0.22 NA NA NA NA 0.35 ...
## $ PLT : int 264 260 385 416 437 439 391 311 333 285 ...
## $ RBC : num 4.2 4.8 3 2.8 3.5 3.5 3.4 3.3 3.8 3.5 ...
## $ WBC : num 8.4 8.47 13.2 14.2 13.8 10.9 9.65 8.98 8.77 8.85 ...
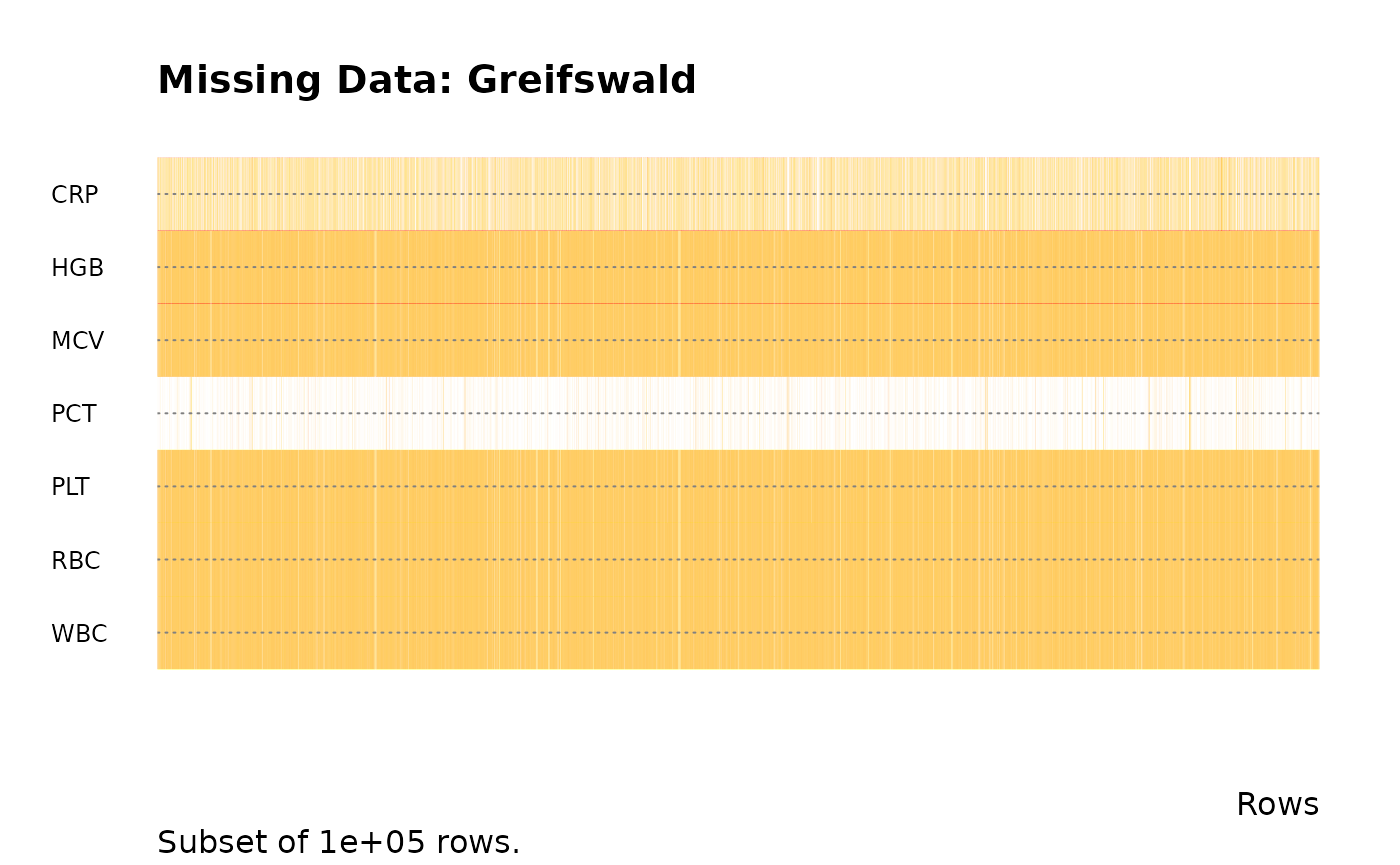
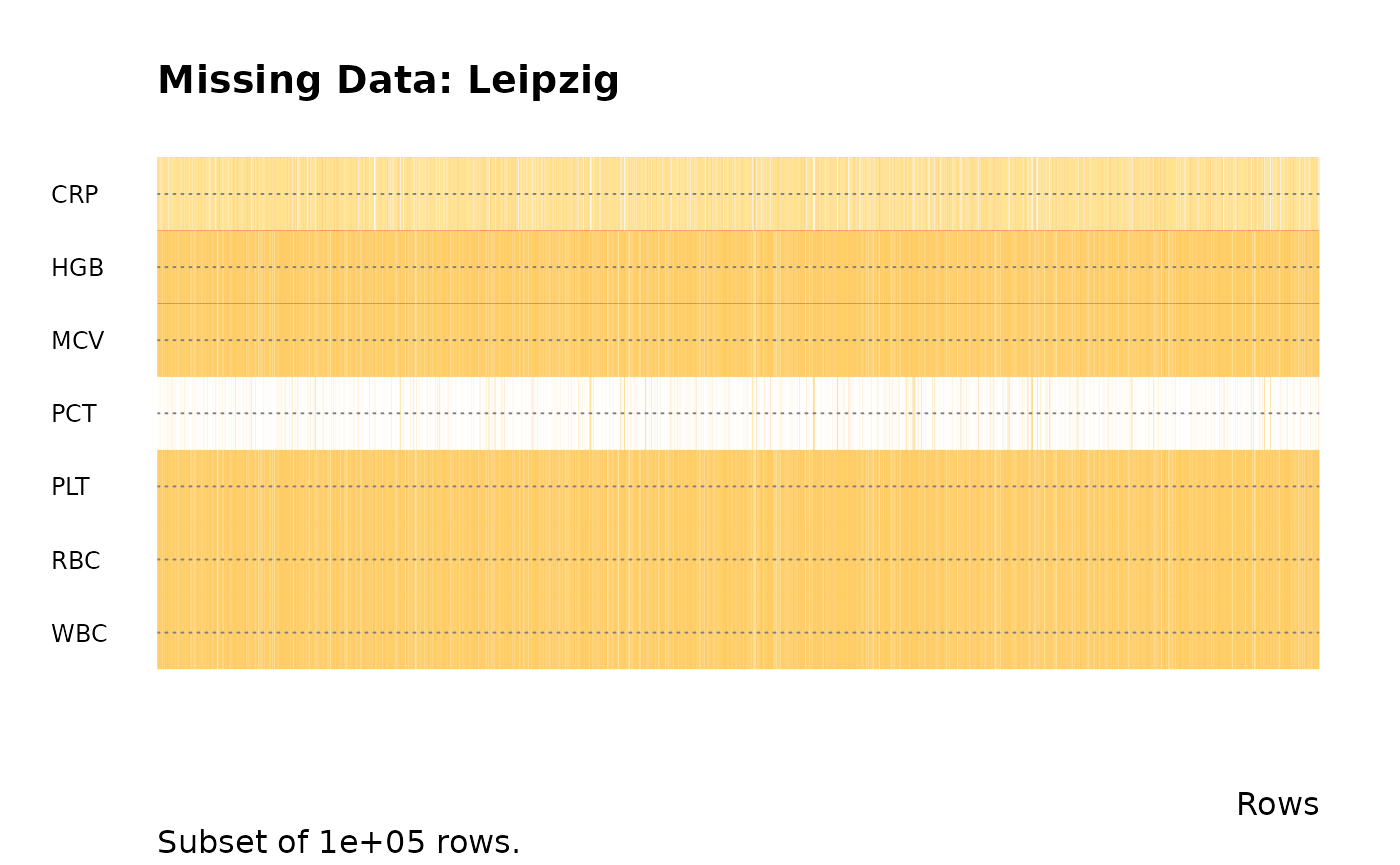
## - attr(*, ".internal.selfref")=<externalptr>Missing data
centers <- c("Greifswald", "Leipzig")

labs <- sbcdata[, labcodes$Code, with = FALSE]
labs <- as.matrix(labs)
labsna <- is.na(labs)
mode(labsna) <- "numeric"

nna <- rowsum(labsna, group = sbcdata$Center)
nna <- rbind(nna, Total = colSums(nna))
knitr::kable(t(nna), caption = "Missing Data")| Greifswald | Leipzig | Total | |
|---|---|---|---|
| CRP | 344944 | 737450 | 1082394 |
| HGB | 19715 | 109956 | 129671 |
| MCV | 19726 | 109978 | 129704 |
| PCT | 620732 | 1885699 | 2506431 |
| PLT | 20059 | 110912 | 130971 |
| RBC | 19725 | 109973 | 129698 |
| WBC | 19725 | 109955 | 129680 |
pna <- round(nna / c(table(sbcdata$Center), nrow(sbcdata)) * 100, 2)

knitr::kable(t(pna), caption = "Missing Data [%]")| Greifswald | Leipzig | Total | |
|---|---|---|---|
| CRP | 51.83 | 36.08 | 39.95 |
| HGB | 2.96 | 5.38 | 4.79 |
| MCV | 2.96 | 5.38 | 4.79 |
| PCT | 93.26 | 92.26 | 92.50 |
| PLT | 3.01 | 5.43 | 4.83 |
| RBC | 2.96 | 5.38 | 4.79 |
| WBC | 2.96 | 5.38 | 4.79 |
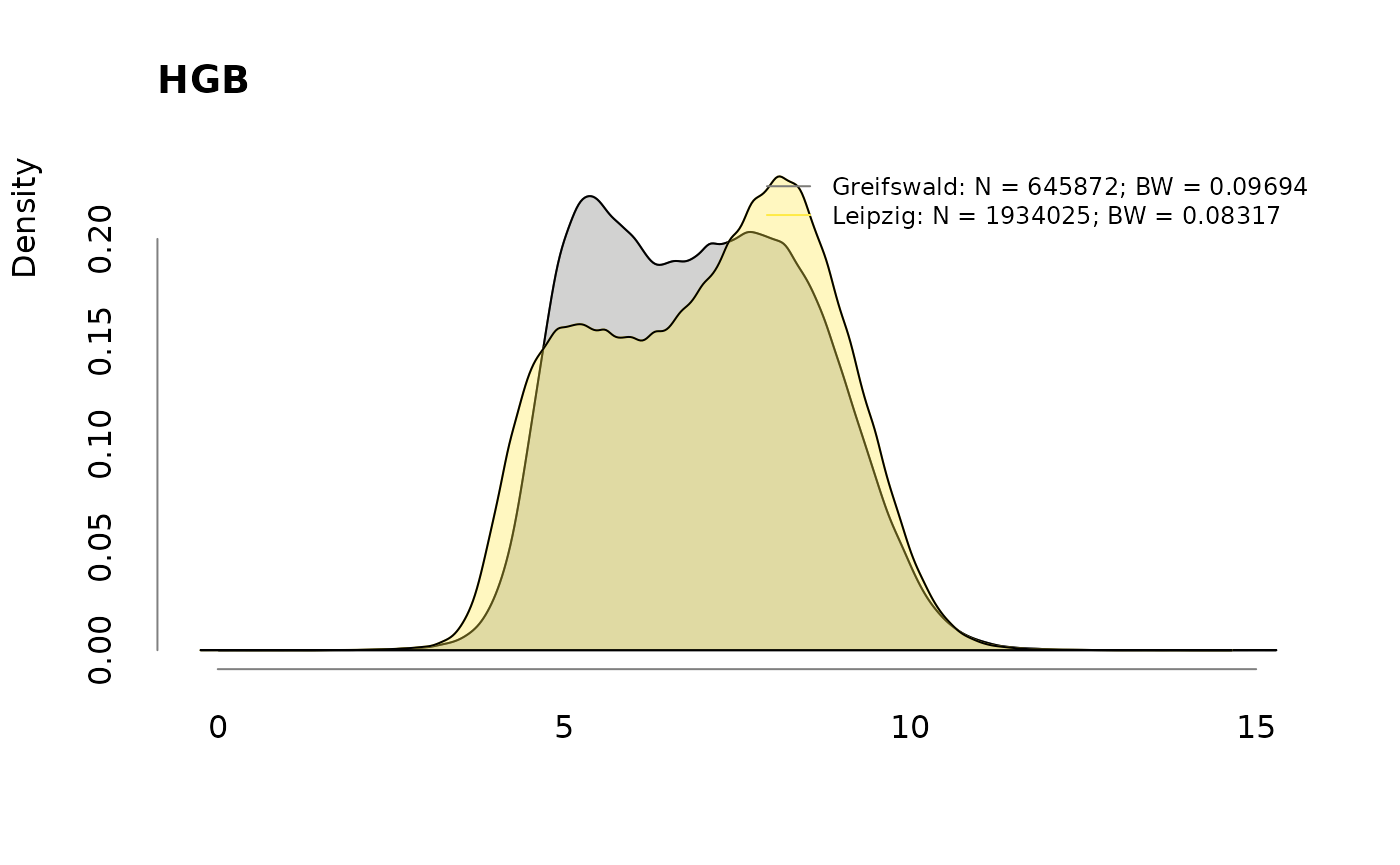
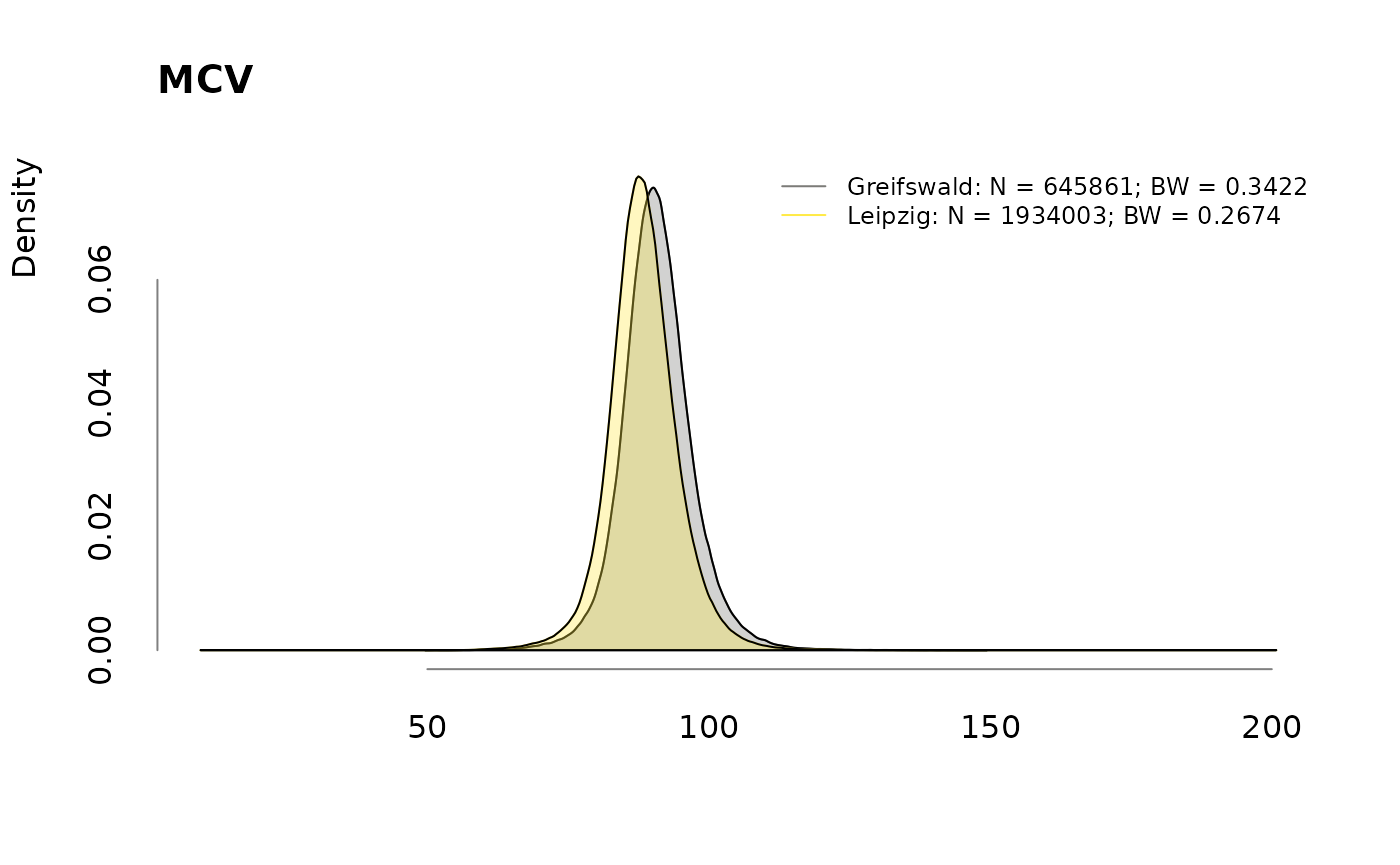
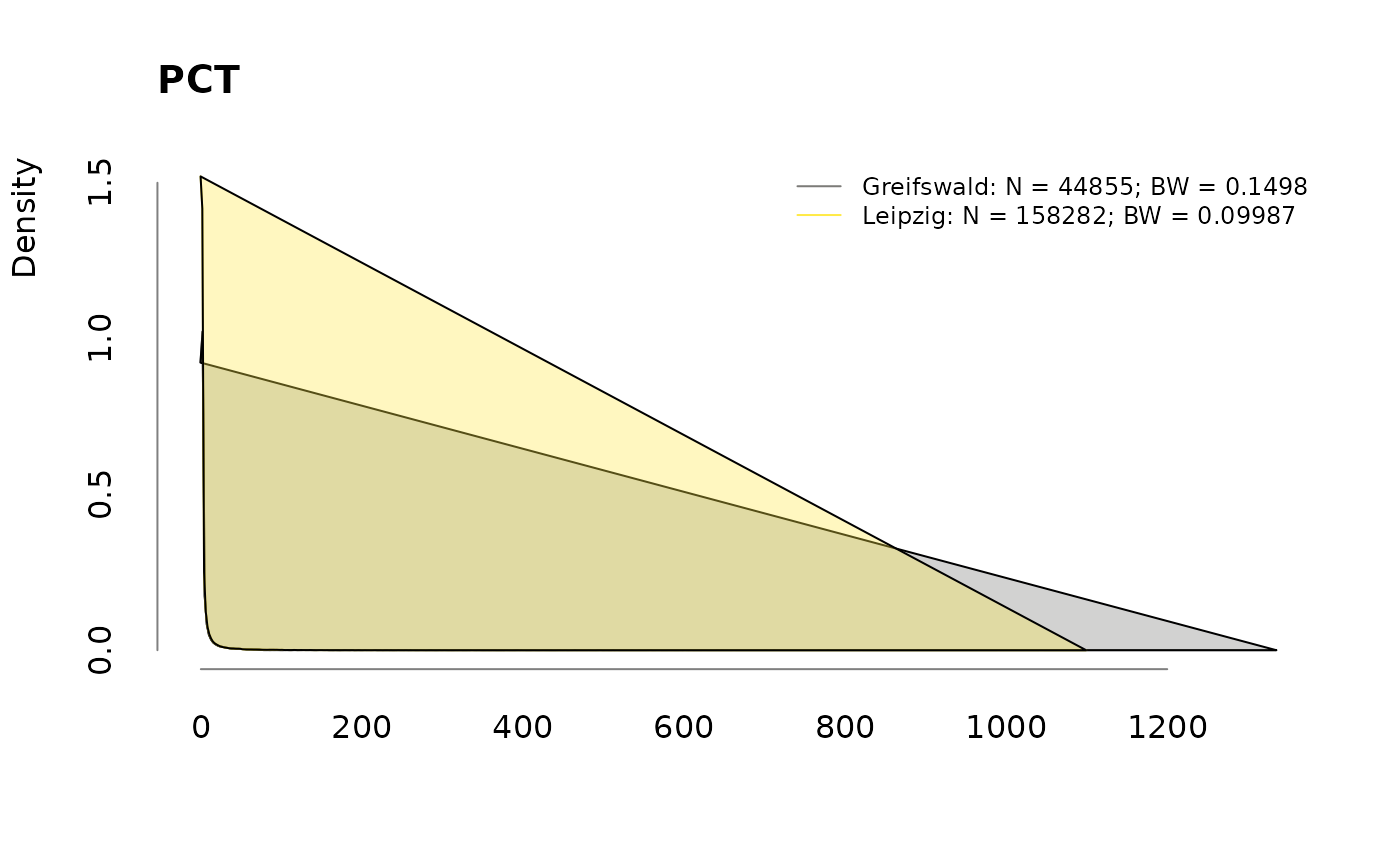
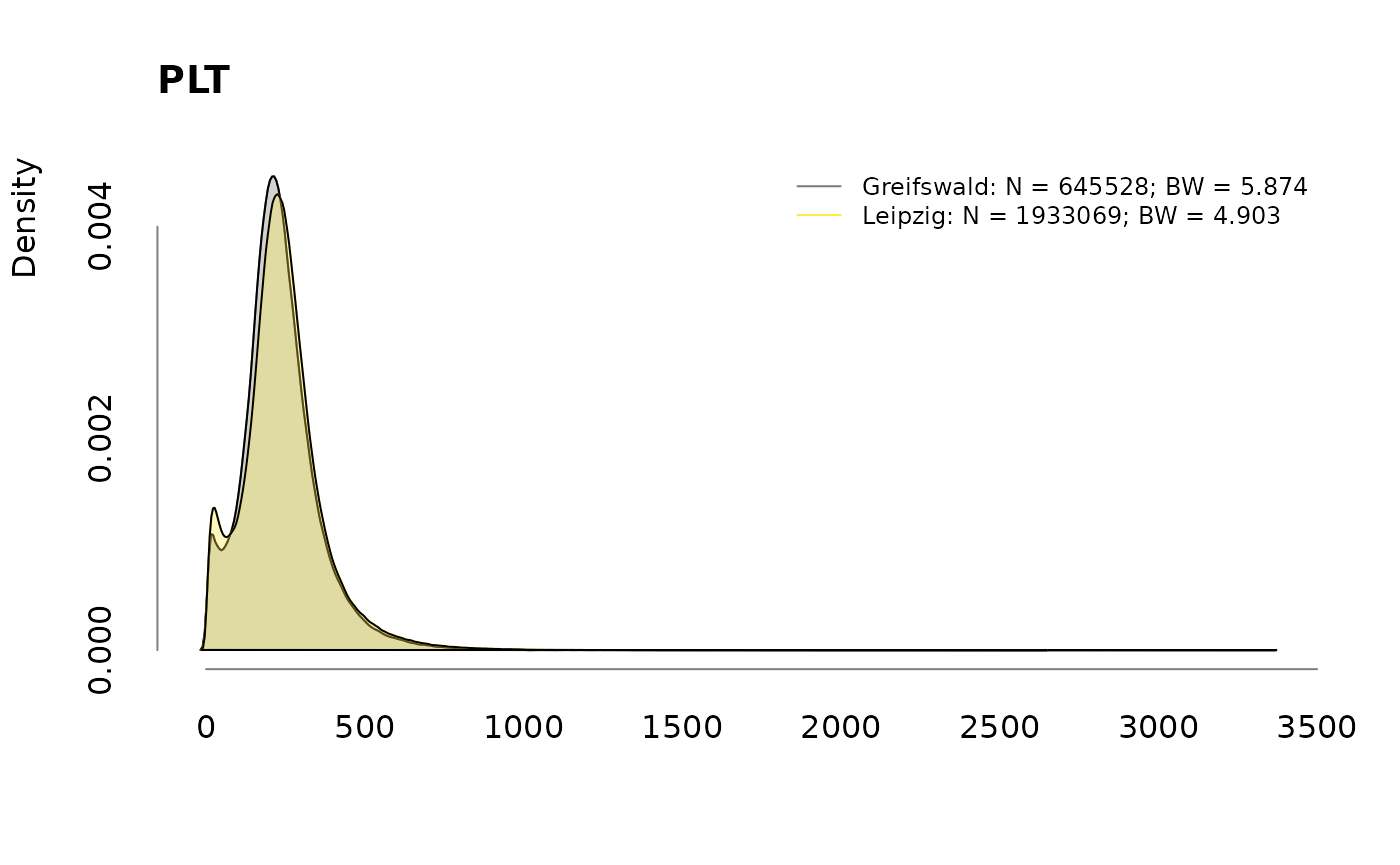
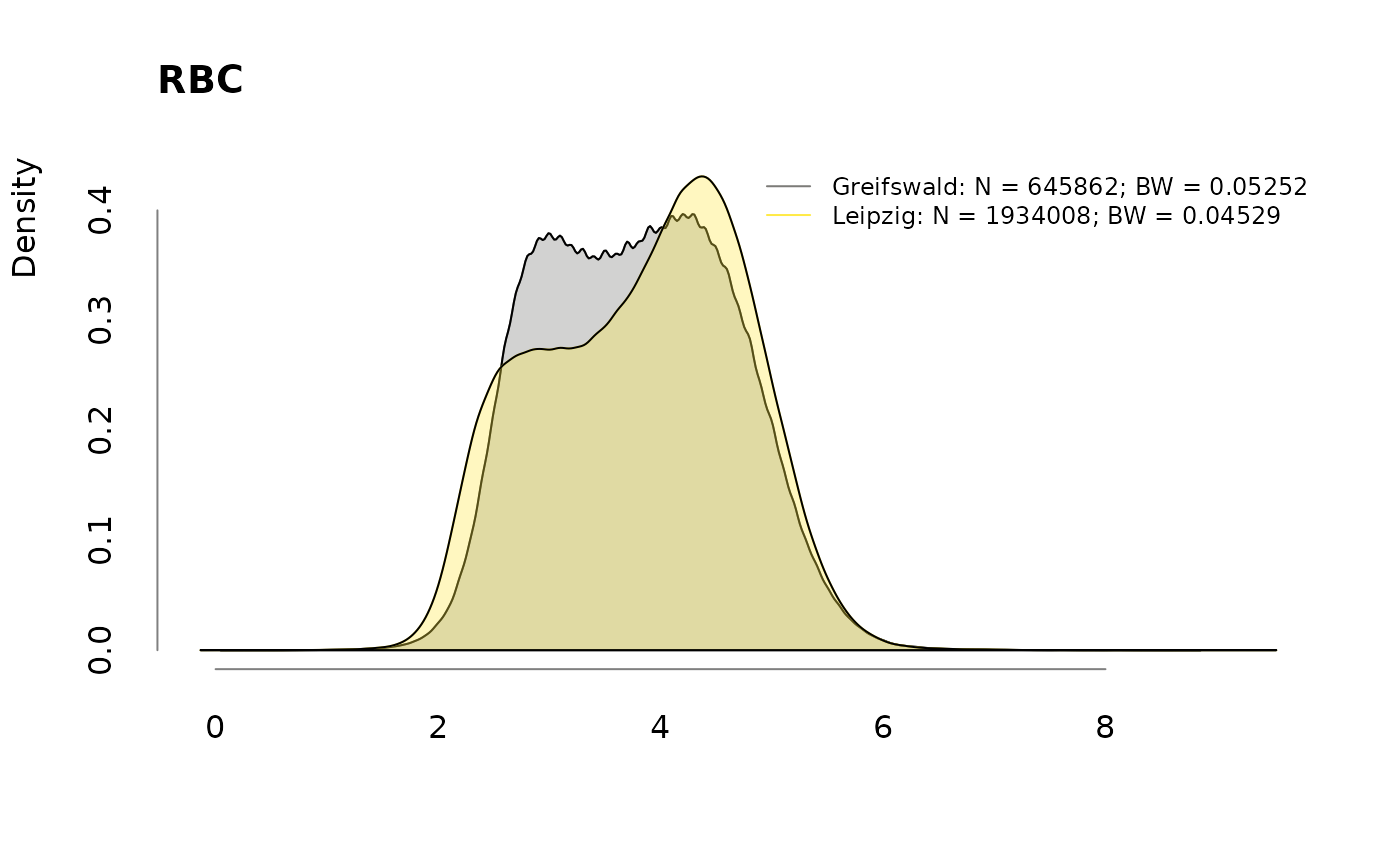
Densities
.plotdens <- function(l, main,
                      col = viridisLite::cividis(length(l) + 1)[-1L]) {
    old.par <- par(no.readonly = TRUE)
    on.exit(par(old.par))

    d <- lapply(l, density, na.rm = TRUE)
    xlim <- range(vapply(d, function(x)range(x$x), double(2)))
    ylim <- c(0, max(vapply(d, function(x)max(x$y), double(1))))

    plot(
        NA, xlim = xlim, ylim = ylim,
        axes = FALSE, xlab = "", ylab = "", main = ""
    )
    for (i in seq_along(d)) {
        lines(d[[i]], col = col[i])
        polygon(d[[i]], col = sub("FF$", "55", col[i]))
    }
    title(main = main, adj = 0L)
    title(ylab = "Density", adj = 1L)
    legend(
        "topright",
        legend = paste0(
            names(l), ": ",
            "N = ", vapply(d, function(x)x$n, integer(1)), "; ",
            "BW = ", vapply(d, function(x)formatC(x$bw), character(1))
        ),
        col = col, lty = 1, lwd = 1, cex = 0.75, bty = "n"
    )
    axis(1, lwd.ticks = 0L, col = "#808080")
    axis(2, lwd.ticks = 0L, col = "#808080")
}

for (v in colnames(labs))
    .plotdens(split(labs[, v], sbcdata$Center), v)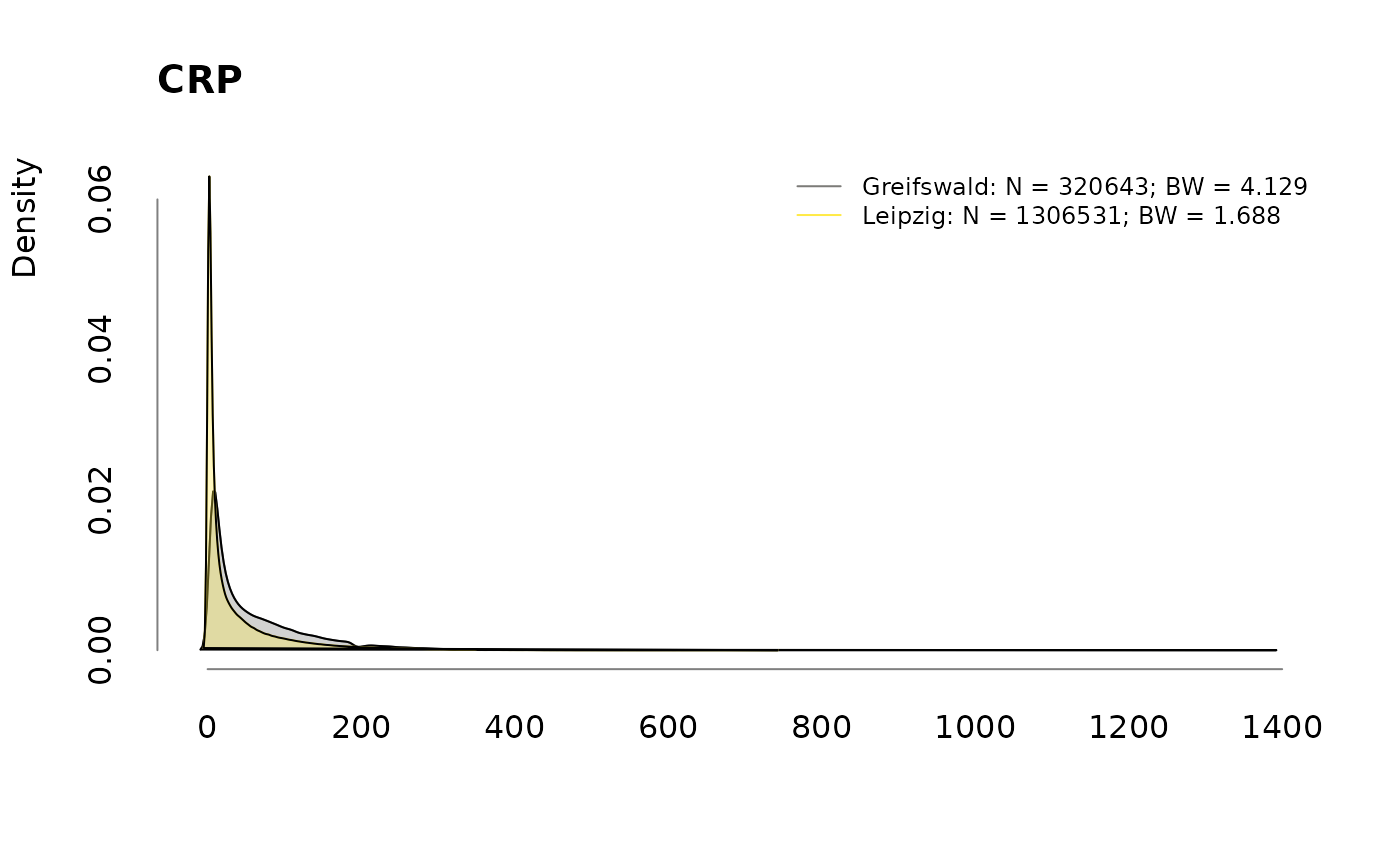


Prevalence
dup <- duplicated(sbcdata[, .(Id, Center)])
tbl <- table(sbcdata[!dup, .(Center, Diagnosis)])
addmargins(tbl)
## Diagnosis
## Center Control Sepsis SIRS Sum
## Greifswald 161160 6995 986 169141
## Leipzig 732763 10231 1211 744205
## Sum 893923 17226 2197 913346
proportions(tbl, margin = 1)## Diagnosis
## Center Control Sepsis SIRS
## Greifswald 0.952814516 0.041356028 0.005829456
## Leipzig 0.984625204 0.013747556 0.001627240Session Information
## R version 4.3.3 (2024-02-29)
## Platform: x86_64-pc-linux-gnu (64-bit)
## Running under: Ubuntu 22.04.4 LTS
##
## Matrix products: default
## BLAS:   /usr/lib/x86_64-linux-gnu/openblas-pthread/libblas.so.3
## LAPACK: /usr/lib/x86_64-linux-gnu/openblas-pthread/libopenblasp-r0.3.20.so;  LAPACK version 3.10.0
##
## locale:
##  [1] LC_CTYPE=C.UTF-8       LC_NUMERIC=C           LC_TIME=C.UTF-8
##  [4] LC_COLLATE=C.UTF-8     LC_MONETARY=C.UTF-8    LC_MESSAGES=C.UTF-8
##  [7] LC_PAPER=C.UTF-8       LC_NAME=C              LC_ADDRESS=C
## [10] LC_TELEPHONE=C         LC_MEASUREMENT=C.UTF-8 LC_IDENTIFICATION=C
##
## time zone: UTC
## tzcode source: system (glibc)
##
## attached base packages:
## [1] stats     graphics  grDevices utils     datasets  methods   base
##
## other attached packages:
## [1] sbcdata_1.0.2     data.table_1.15.2
##
## loaded via a namespace (and not attached):
##  [1] vctrs_0.6.5       cli_3.6.2         knitr_1.45        rlang_1.1.3
##  [5] xfun_0.42         highr_0.10        purrr_1.0.2       textshaping_0.3.7
##  [9] jsonlite_1.8.8    htmltools_0.5.7   ragg_1.2.7        sass_0.4.8
## [13] rmarkdown_2.26    evaluate_0.23     jquerylib_0.1.4   fastmap_1.1.1
## [17] yaml_2.3.8        lifecycle_1.0.4   memoise_2.0.1     compiler_4.3.3
## [21] fs_1.6.3          systemfonts_1.0.5 digest_0.6.34     viridisLite_0.4.2
## [25] R6_2.5.1          magrittr_2.0.3    bslib_0.6.1       tools_4.3.3
## [29] pkgdown_2.0.7     cachem_1.0.8      desc_1.4.3